There are plenty of places to analyze Solana tokens: DEXscreener, Birdeye, DeFiLlama, Solscan, CoinGecko, CoinMarketCap, the list goes on.
So why build Solsearch?
Is it just to be different? Just because we like building stuff?
Well…yes, we do like building. But only when there’s a real opportunity to create value.
So let’s dive into the opportunities we see (i.e., what existing analytics platforms are missing) and the value we provide (i.e., how Solsearch is introducing a new perspective).
Today’s token dashboards
Today’s dashboard types fall into two broad buckets:
1. Live streaming/trading-like dashboards
(e.g. DEXscreener, Birdeye)
Common traits:
- ~70% of the screen is consumed by a candlestick chart
- ~10% of the screen is consumed by a live order book
- The UI emphasizes price and market cap above all else
While real-time candlestick charts are fun to watch, it’s mostly noise to us. Price action can be helpful for a last second check when buying, but otherwise it’s not actually much of a meaningful signal for a token’s health.
Our hypothesis:
Most users aren’t performing technical analysis, especially not on freshly minted tokens or relatively new tokens that are weeks or even a few months old. For us, candlestick charts are largely a waste of space. A simple price chart is enough. What matters is the health of the token..how much liquidity there is across pools, how many ‘real’ holders there are, and more.
2. Generalized analytics platforms
(e.g. Solscan, CoinGecko, CoinMarketCap)
These are more surface-level. Common traits:
- Basic stats: price, market cap, token supply
- Can be inaccurate or missing circulating supply
- No deeper liquidity or holder insights
- No multi-pool aggregation or behavioral data
In both cases, what’s missing is more valuable than what’s shown. The data being displayed is commoditized at this point across mostly all analytics platforms.
Our goal: to surface only high signal metrics
Solsearch is built to give you a quick gut check on a token’s quality, while enabling you to dig deep when needed. Candlestick charts? Not high signal. Showing total supply? Helpful, but not enough.
Here’s how we’re doing that from two main perspectives.
Product-focused builders.
We’re being really critical about what metrics we show above the fold and below the fold. As we add more metrics, continuing this emphasis on UX is critical. Most analytics platforms are overwhelming and confusing. Your eyes don’t know where to go.
We’re changing this by avoiding an overwhelming experience and thinking deeply about where we place new metrics and how they look on the page.
Delivering metrics that matter.
Here is what’s live now:
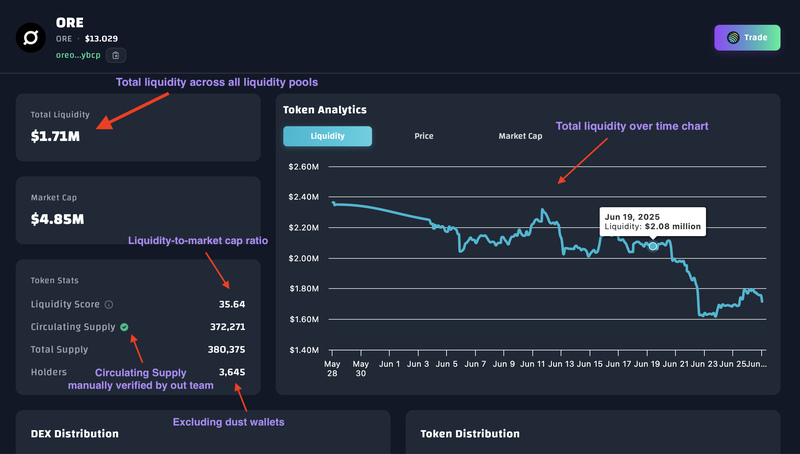
- Aggregated liquidity across all pools for a token (e.g., DEXscrener shows liquidity in just one pool, and the candlestick chart is the activity of one pool). More liquidity generally means more interest and a project that will last in highly volatile markets.
- Liquidity over time – view trends, not just snapshots
- Liquidity-to-market cap ratio – a quick-read “liquidity score”. A higher ratio signals strong liquidity which means large trades have less impact on price movement.
Below is a quick screenshot of a token page:
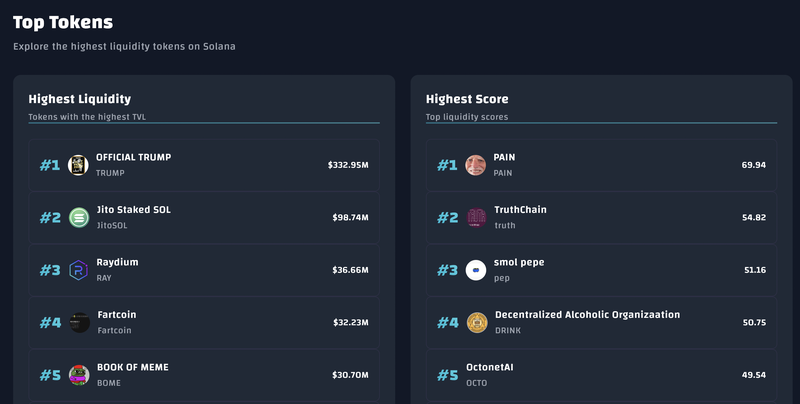
We also show top token lists by total liquidity and liquidity scores (liquidity-to-market cap ratio)
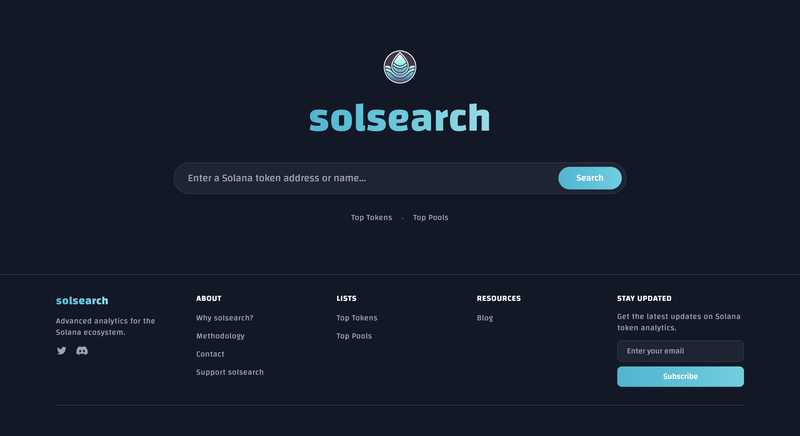
Additionally, with a focus on simplicity, when you hit our homepage, it's very clear that users should search for a token and dive in:
Coming in the future:
- Holder distribution – using the Gini coefficient to show that wealth isn’t too aggregated to a select few holders
- Real holder count – excluding dust wallets (which we’ll define and add to methodology page) to cut through airdrop fluff and bots
- Liquidity depth views – view how liquidity is distributed across price bands, see which pool providers stack up at each price band, compare pools, and more
- Momentum indicators – get a sense of which tokens are heating up
- Authority visibility – see mint, upgrade, and freeze privileges at a glance
Not just “another analytics platform”
We’re not trying to out-DEXscreener DEXscreener or compete with Solscan, etc... They’re great products for what they do. But they don’t fit all of our needs for what we want when analyzing a token.
Solsearch is a fresh approach for a different kind of user: one who cares less about candlestick charts, and more about whether the token is worth your time.
This can work (and is currently working) for different persona types:
- The degen: You aped into something an hour ago, you're questioning some basic things like how liquid is the market.
- The researcher: You want to compare token fundamentals, liquidity metrics, and gain a sense of ‘real’ holder count.
- The builder or founder: You want to know how your token looks across the ecosystem and where it stands versus competitors. View our top liquidity and liquidity score lists.
It’s the analytics platform we wish already existed. And this is just the beginning.
So we’re building it.
Stay tuned for what’s to come!